

Why I use charts
And why I’m building OnlyCharts.

One of the biggest lessons I’ve learned as a investor is:
Fundamentals tell me what I might want to buy. Charts help me decide when to buy it.
A good company is not always a good stock at every point in time.
You can be right about the business, right about the valuation, right long term— and still buy at the wrong moment.
You can buy too early.
You can buy a broken downtrend.
You can buy when the stock looks “cheap” but the market is still selling.
You can buy before there is any sign that sentiment has turned.
You can buy when volume is thin, and there is no real evidence of demand.
That is where the chart paints the picture.
It shows market consensus: and what investors are actually doing.
The market is never wrong, but your timing can be.
Supply and demand, sentiment, accumulation and distribution.
They show whether a stock is being ignored, sold, supported, accumulated, or re-rated.
For me, charts are not a replacement for fundamental research. I have specific preferences here too, which I will cover in a future post.
But they are the next tool, once they earn a spot on my watchlist.
I use them for entries and exits, to maximise upside, limit downside, and keep capital turning over rather than trapped in dead ideas.
Fundamentals first. Charts second.
Once a company is on my watchlist, I think about the following to decide which stocks I want to buy next.
Is price improving or weakening?
Is a base forming, indicating that sellers are exhausting?
Where is the key level it needs to beat?
Is volume confirming the move?
Is the stock outperforming the market?
Is liquidity a risk?
Is the setup clean, early, extended, or messy?
Is the market starting to recognise the story?
Price action, trend, key levels, volume, liquidity, market strength and setup quality.
All things OnlyCharts is being designed to help you read.
Why timing matters
I have become increasingly focused on capital efficiency.
To have any chance of achieving my personal goal of doubling my portfolio every year, I need to be.
If I buy a stock and it does nothing for months, there is an opportunity cost.
That capital could potentially be working elsewhere.
Compounding.
So timing is everything.
Inspiration Healthcare (IHC) : a real life example
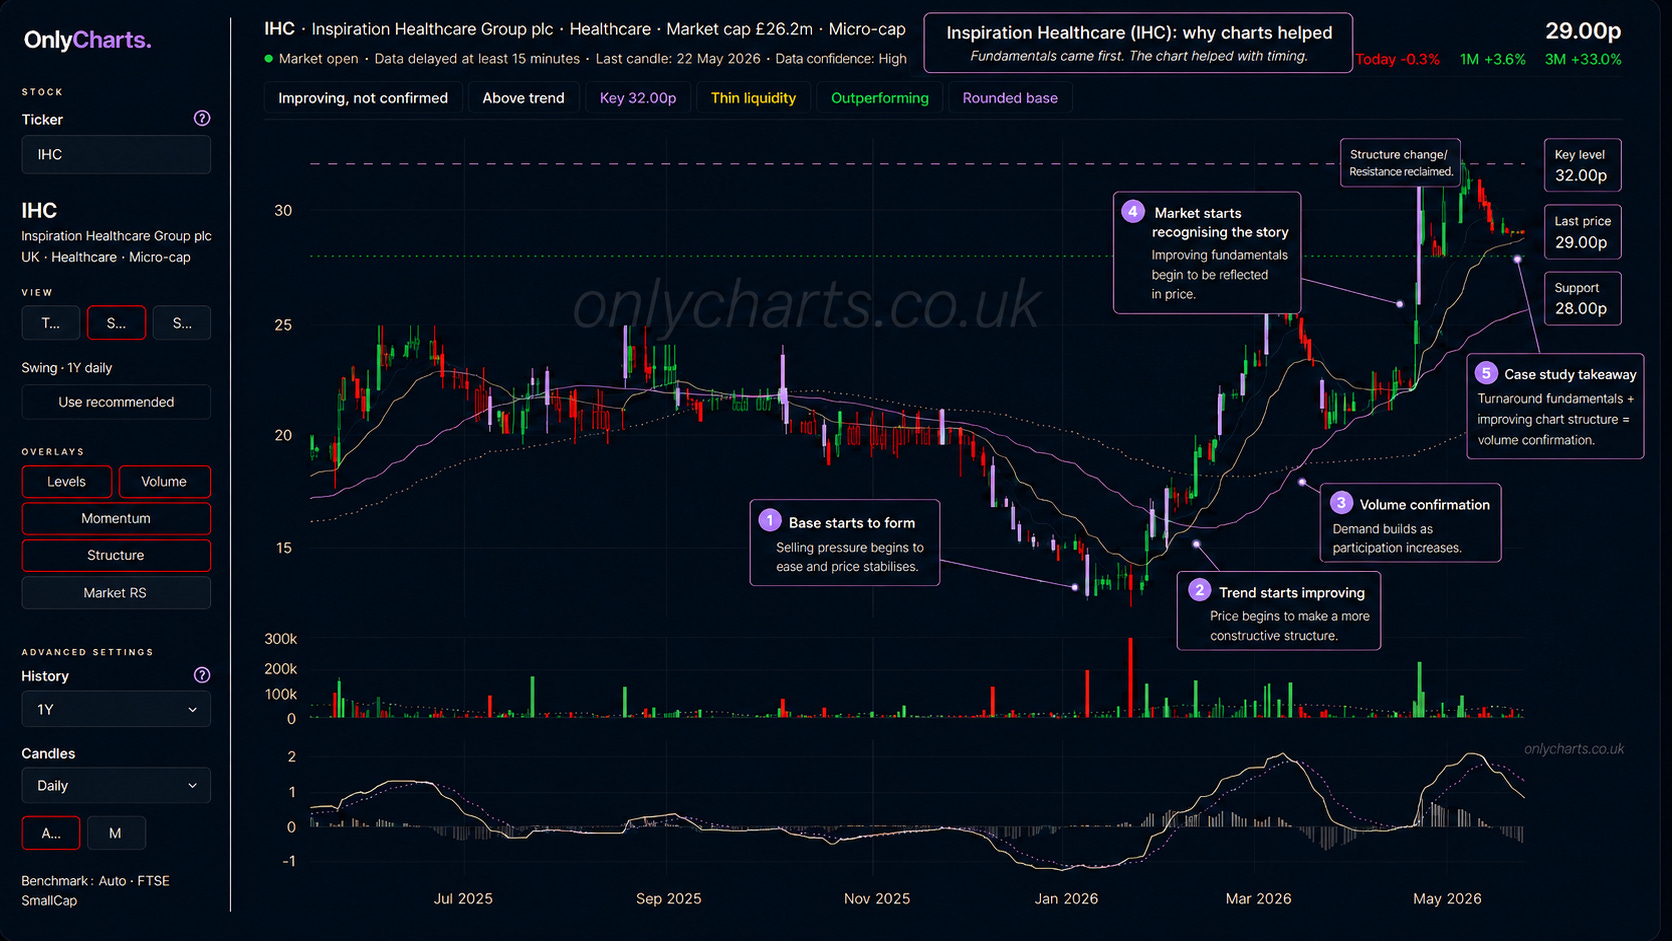
Inspiration Healthcare has been my biggest winner to date and price action and volume, helped me spot the move early.
Fundamentally it wasn’t the strongest, and the kind of stock I’m looking for is never going to be because if it was, there wouldn’t be the kind of upside returns on offer I’m looking for. But nevertheless, it’s a proper business.
From summer last year the price had been slowly drifting lower.
Then early this year it started to trend sideways.
That usually means the bad news or weak sentiment is already priced in, and sellers are running out of steam.
Anyone who wanted to sell the stock is gone or have given up!
Buyers and sellers are in equilibrium.
The price stopped making fresh lows, and began to stabilise which suggests the downtrend was tiring.
A base began to form.
Next came more supporting price action (the share price started to tick up for a change instead of down).
Buyers are starting to take control.
Volume picked up - which we now know was a institution accumulating (Redworth capital) in this instance.
Then eventually in April the wider market caught up, fundamentals were confirmed as improving, pushing the shares even higher.
That combination — improving chart structure, a large buyer accumulating and turnaround story gaining traction, — helped me ride the move like a wave.
With hardly any pullbacks along the way!
The setup I’m looking for
The ideal setup for me looks like this:
Selling pressure slowing down.
Before a stock can start a new move, it needs time to stop falling. I want to see signs that sellers are losing control, price is stabilising, and the stock is starting to form a base rather than continuing to make new lows. Don’t fight the tape.
A rising trend.
I want to see price starting to tick up again before I will consider pulling the trigger. I’m not trying to fish the exact bottom; Tried to do that before, it’s almost impossible and cheap stocks can always get cheaper.
Volume confirmation.
I want to see whether there is real participation behind the move. I am wary of moves on thin liquidity and low volume. Increasing volume coming into the stock helps show whether demand is real or not. Low volume either way is not to be trusted.
Market recognition.
I want to see early signs the stock is starting to outperform its benchmark or peer group. If the fundamentals are improving but the stock continues to lag, you have to ask yourself why.
Why I’m building OnlyCharts
I built OnlyCharts because I wanted a simpler way to read the chart evidence I actually use.
Price action.
Trend.
Key levels.
Volume.
Liquidity.
Relative strength.
Setup quality.
I did not want to piece all of that together across lots of different screens.
There are plenty of tools out there, many of which I use, but they tend to be either broadly centred around rear-view-mirror data metrics, such as fundamentals, or too focused on day trading.
So I’m building the tool I wanted for my own process.
A distraction free chart-reading layer for swing trading UK small caps.
Focused purely on execution of my watchlist ideas.
Access for paid subscribers
OnlyCharts is still in testing, and I’m already using it as part of my regular workflow.
But the plan is to make it available to paid “SmallCapsBigBags” subscribers from July 2026.
After launch, OnlyCharts is expected to become a paid add-on or separate product for new subscribers.
That means early paid subscribers will get founding access before separate pricing. And complimentary accesss to all features whilst they remain subscribed.
This is still a beta, and I am looking for early adopters to help shape where the product goes next.
So if there are chart-specific indicators, features, overlays or data points you use in your own process, specifically for swing trading UK small caps please let me know in the comments below or feel free drop me an email at help@onlycharts.co.uk.
I’d also be interested to know how you use charts today:
OnlyCharts.co.uk.
You can follow @SmallCapsBigBags on X for daily UK small-cap updates.
The public portfolio tracker is at smallcapsbigbags.com.
Up next:
📊May Portfolio Update & 12-Month Review: Four Multi-Baggers, One Takeover Bid and a £50k Portfolio

Small Caps. Big Bags. is an open investment journal where I document my high-conviction small-cap portfolio. Each month I share what I buy, what I sell, what works — and what doesn’t. Importantly, this is not financial advice or a stock-picking service. It’s simply a transparent record of my thinking, process, and lessons learned investing in UK small a…
Disclaimer
Nothing in this article is financial advice or a buy or sell recommendation. Always do your own research and make sure any investment approach is suitable for your own circumstances. All content on Small Caps. Big Bags. is for informational and educational purposes only and reflects my personal views. Past performance is no guarantee of future returns. Nothing constitutes financial, investment, legal, or tax advice. I am a private investor, not a regulated adviser. Investing in small-cap and AIM stocks involves significant risk, including volatility, illiquidity, and the potential for total loss of capital.You should conduct your own research and seek professional advice where appropriate.I may hold positions in the stocks mentioned, which may change without notice. No liability is accepted for any losses arising from reliance on this content.
Thanks @Geebee.
Sounds like you’ve got a good quality-first approach on the fundamentals. Over the long term you’d hope that shines through, even if the timing isn’t always perfect.
For timing, I mainly use the 50SMA/20EMA (as its a bit quicker than SMA) for entries, then the 10/20EMA plus support levels when thinking about taking profits or cutting as protecting gains is key for me.
Relative strength is a big one too — I want to see early signs of stock outperforming the market/sector, not just moving with it.
On volume, I look at 10-day vs 3-month volume and pay particular attention if a day's trading is above the 20-day average. OBV/PVT are good shouts though I've never used them myself, but I’ll add them to the OnlyCharts roadmap.
AB Dynamics looks interesting, though a bit bigger and slower than my usual sub-£50m focus. I’ll look at covering it in a future Stock in Focus with charts too.
Thanks for your support!
“Fundamentals tell me what I might want to buy. Charts help me decide when to buy it” … spot on!
Thank you for a great article. Fits perfectly with my approach. Most investors in the UK, it seems to me, take a value approach and don’t pay much attention on the ‘when to buy’ (and ‘when to sell’) question.
I use the same indicators as the one you mentioned: price daily & weekly, 10/20/50/200 SMAs, relative strength ranking, Donchian 52w high & low and Volume (incl 10/21 day MA). I also like to see ATRs - useful for trailing stops though the 20/50 dMA works too.
I was wondering why the world would need another charting package but I currently have to subscribe to Stockopedia, TradingView and MarketInOut to get everything I need. I use Stocko for StockReports, RNS, screening using Q & M StockRanks and portfolio tracking. The charts are awful and I have pestered them to do something about it but they are not interested (even an API to TradingView would be better than what they offer currently!). So I am forced to use TradingView for charts, which is fine but I resent paying for it. I use MarketInOut for tracking markets (FTSE indices etc) and like the fact that it includes indicators such as volume, NH-NL, advance vs decline etc. I also dabbled with the back-testing.
I also looked at TradeZilla and similar trade tracking tools but they are too US-focused so I have invested a lot of time developing my own trade tracking tools to monitor KPIs like win rate, average in, average loss, expectancy etc
Bottom line is that it would great to have a UK-focused tool that bought all this together (or at least the charting element).
So I’m keen to find out more!